8 Critical Customer Service Performance Indicators

In a competitive market, exceptional customer service isn't just a goal; it's a critical driver of growth and retention. But how do you know if your support efforts are truly hitting the mark? Vague feelings of success aren't enough. To build a world-class service organization, you need objective, quantifiable data that provides a clear roadmap for improvement. That's where customer service performance indicators (KPIs) come in, transforming abstract concepts like satisfaction and efficiency into concrete numbers.
These metrics are the foundation for evaluating team effectiveness. To understand the foundational principles of evaluating team effectiveness, explore this comprehensive guide to performance tracking. Tracking the right KPIs allows you to pinpoint weaknesses, celebrate strengths, and make strategic decisions based on hard evidence rather than guesswork.
This guide breaks down the eight most essential customer service performance indicators you need to start tracking today. We'll explain not just what they are, but how to calculate them, what good looks like, and how to use them to create truly effortless customer experiences. We'll move beyond simple definitions to give you the actionable strategies needed to turn raw data into tangible, business-defining results.
1. Customer Satisfaction Score (CSAT)
The Customer Satisfaction Score (CSAT) is one of the most direct and widely used customer service performance indicators. It measures how happy a customer is with a specific interaction, product, or service they just experienced. This metric relies on a simple, direct question, such as, "How satisfied were you with your experience today?"
Customers typically respond on a numerical scale, most commonly 1 to 5. The final CSAT score is calculated as a percentage of "satisfied" responses (usually a 4 or 5) out of the total number of responses received. For example, if you receive 100 responses and 80 of them are a 4 or 5, your CSAT score is 80%.
This focused approach makes CSAT incredibly useful for pinpointing satisfaction levels at key moments in the customer journey. Airlines use it after a flight, Apple sends a survey after a Genius Bar appointment, and e-commerce stores use it to gauge satisfaction with a recent delivery.
How to Implement and Improve CSAT
Tracking CSAT effectively requires a strategic approach to both data collection and analysis.
- Timing is Everything: Send the survey immediately after the interaction. A customer’s memory is freshest right after a support call ends or a product is delivered.
- Keep it Simple: Limit your survey to 1-3 questions. A single-question survey has a much higher completion rate. Always include an optional open-ended question like, "How could we have improved your experience?" to understand the why behind the score.
- Segment Your Data: Don't just look at the overall score. Break down CSAT results by agent, support channel (email, chat, phone), or interaction type (e.g., billing query vs. technical issue) to identify specific areas for improvement.
The following pie chart visualizes a typical distribution of CSAT responses from a company survey.
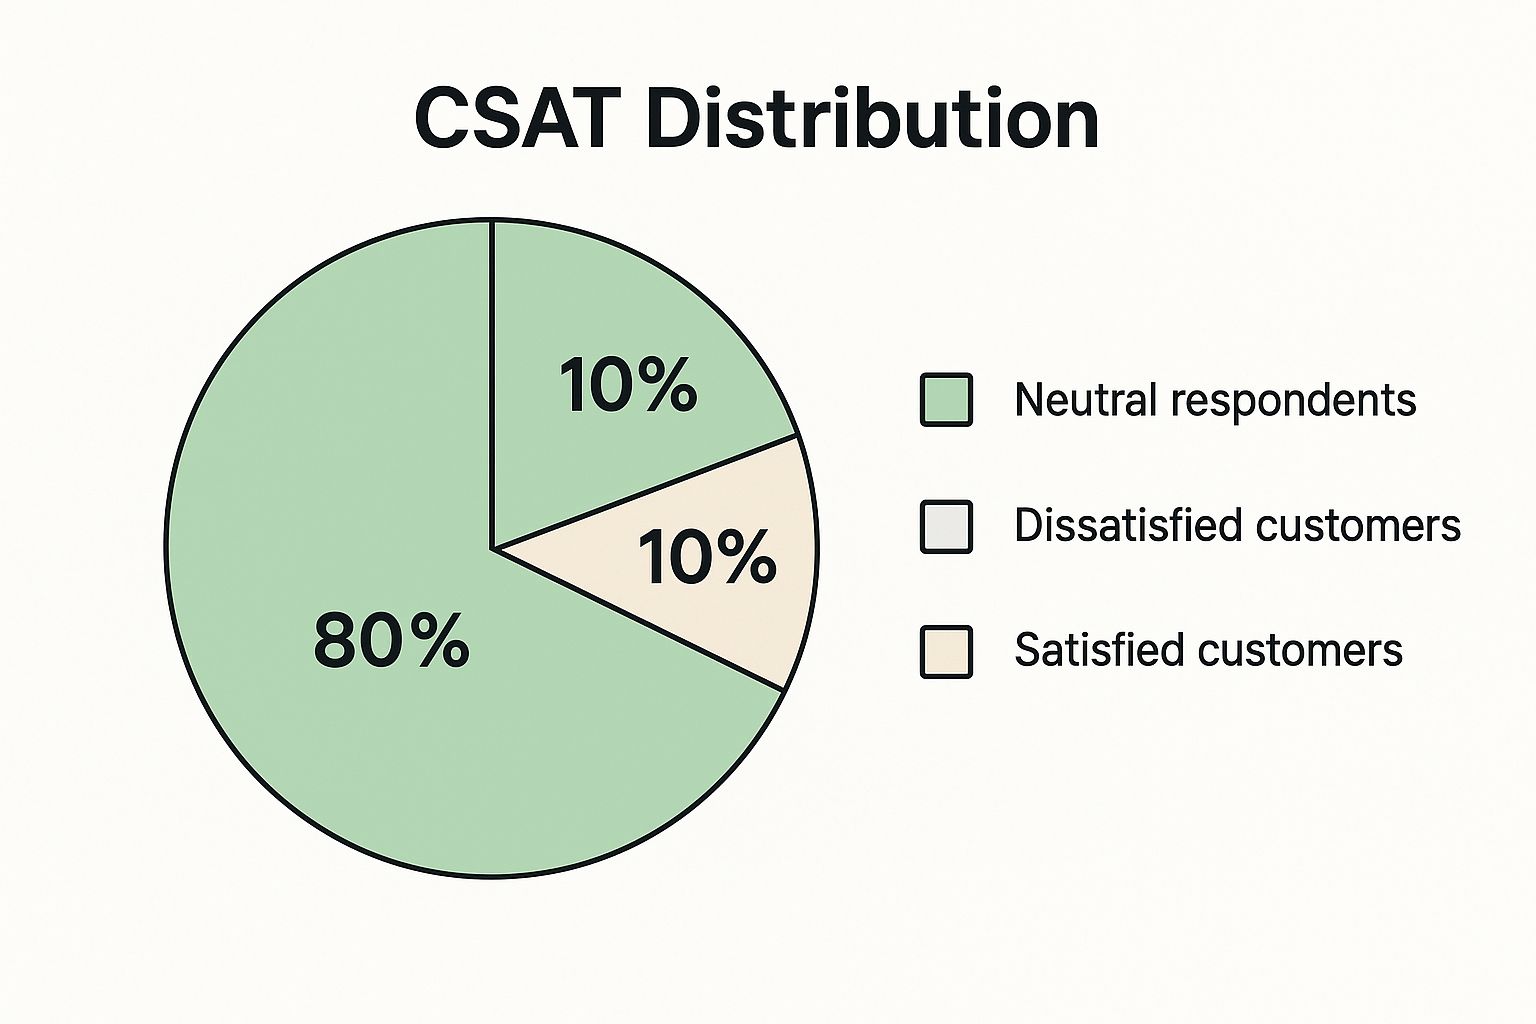
This chart clearly shows that the majority of customers (80%) are satisfied, providing a strong top-line performance indicator.
Beyond just the Customer Satisfaction Score, there are several other critical methods for gaining deeper insights into customer satisfaction, including those covered in a guide to 8 Key Customer Satisfaction Measurement Methods. Using a mix of metrics provides a more complete picture. For more strategies on boosting this key metric, you can explore how to improve customer satisfaction.
2. Net Promoter Score (NPS)
The Net Promoter Score (NPS) is a powerful customer service performance indicator designed to measure long-term customer loyalty and word-of-mouth potential. Introduced by Fred Reichheld of Bain & Company, it hinges on a single, critical question: "On a scale of 0-10, how likely are you to recommend our company to a friend or colleague?" This metric goes beyond transactional satisfaction to gauge overall brand allegiance.
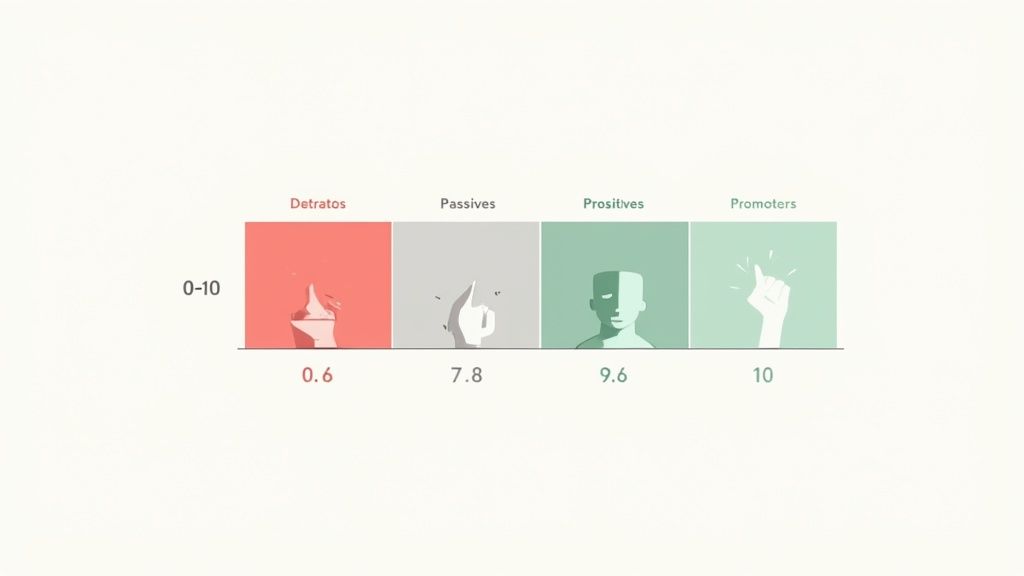
Based on their answers, customers are categorized into three groups: Promoters (score 9-10), Passives (score 7-8), and Detractors (score 0-6). The final NPS score is calculated by subtracting the percentage of Detractors from the percentage of Promoters, resulting in a score that can range from -100 to +100. Companies like Tesla and Apple use NPS to maintain their industry-leading brand loyalty.
NPS is particularly valuable for understanding your customer base at a high level. It helps identify your most enthusiastic advocates and your most at-risk customers, allowing you to tailor engagement strategies accordingly.
How to Implement and Improve NPS
An effective NPS program is about more than just asking the question; it's about acting on the feedback you receive.
- Ask "Why?": Always include an open-ended follow-up question, such as, "What is the primary reason for your score?" This qualitative feedback is crucial for understanding the drivers behind your score and identifying specific areas for improvement.
- Segment Your Score: Analyze NPS results by customer demographic, product line, or stage in the customer lifecycle. This segmentation can reveal that while one product has many Promoters, another might be creating Detractors that need immediate attention.
- Close the Loop: Create a process to act on feedback quickly. Follow up with Detractors within 24-48 hours to resolve their issues and prevent churn. Similarly, engage with Promoters to gather testimonials, reviews, or referrals.
- Track Trends Over Time: Survey customers at consistent intervals (e.g., quarterly) rather than just once. Tracking NPS over time shows whether your customer service initiatives are successfully improving loyalty and provides a clear benchmark for progress.
3. First Response Time (FRT)
First Response Time (FRT) is one of the most critical customer service performance indicators because it measures speed and attentiveness. It tracks the average time it takes for a support agent to provide an initial response to a customer inquiry after it's submitted. This metric directly shapes the customer's first impression of your support quality.
FRT is calculated from the moment a customer creates a ticket or sends a message until the first human agent replies. A lower FRT signals to customers that their issue is acknowledged and valued, which can significantly reduce anxiety and improve their overall perception of your brand.
This metric is essential across all channels, though benchmarks vary. A quick response is paramount. Zappos, for example, is famous for its near-instantaneous replies, while Buffer aims for an impressive FRT of under one hour for email support. Similarly, HubSpot achieved a 15-minute average FRT by strategically implementing live chat, setting a high bar for B2B customer service.
How to Implement and Improve FRT
Tracking and reducing FRT requires a proactive and channel-specific strategy to meet modern customer expectations.
- Set Channel-Specific Goals: A reasonable FRT for email might be a few hours, but for live chat, it should be under two minutes. Define and communicate clear internal targets for each support channel your team manages.
- Use Smart Automation: Implement automated email or chat responses to immediately acknowledge receipt of a customer's query. This simple step confirms the message was received and sets a clear expectation for when a human agent will follow up.
- Optimize Staffing and Triage: Monitor FRT data by time of day and day of the week to identify peak periods. Use this information to optimize agent shift schedules. Implement a triage system that prioritizes urgent inquiries to ensure they receive the fastest possible response.
- Prevent Rushed, Low-Quality Replies: While speed is important, it should not come at the expense of quality. Train agents to provide a thoughtful and helpful first response, not just a quick one. Balancing FRT with other quality metrics like CSAT is crucial for sustainable success.
4. First Contact Resolution (FCR)
First Contact Resolution (FCR) measures the percentage of customer issues resolved during the first interaction, with no need for follow-up contacts or escalations. It is one of the most crucial customer service performance indicators because it directly impacts customer satisfaction and operational efficiency. When an issue is resolved on the first try, it saves time and resources for both the customer and the company.

The formula for FCR is simple: (Total number of issues resolved in the first contact / Total number of contacts received) x 100. Companies with high FCR rates, like American Express and USAA, demonstrate a commitment to effective problem-solving, which builds significant customer loyalty. A high FCR rate means agents are well-equipped, processes are streamlined, and customers leave the interaction feeling heard and helped.
This metric is particularly valuable for support centers that handle a high volume of technical or complex queries. Tracking it helps identify friction points in the customer journey and highlights gaps in agent knowledge or system capabilities.
How to Implement and Improve FCR
Boosting your FCR rate involves empowering your team and optimizing your internal processes. A focused strategy can yield significant improvements in both efficiency and customer happiness.
- Empower Your Agents: Give agents the authority to make decisions, such as issuing a refund or applying a credit, without needing manager approval. This autonomy allows them to solve problems on the spot.
- Invest in Knowledge Systems: Implement a robust and easily searchable internal knowledge base. When agents can find accurate information quickly, they can resolve issues faster and more effectively.
- Analyze Repeat Contacts: Regularly review why customers are contacting you a second or third time for the same issue. This analysis helps you identify root causes, whether it’s a product flaw, a confusing policy, or a gap in agent training.
- Survey for Confirmation: Don't just assume an issue is resolved. Send a simple follow-up survey asking, "Was your issue resolved today?" to confirm the resolution from the customer’s perspective. This provides a more accurate FCR measurement.
By focusing on First Contact Resolution, businesses can significantly reduce customer effort and decrease operational costs, making it a powerful lever for a superior service experience. Organizations like the SQM Group have published extensive research showing the direct link between higher FCR and improved customer satisfaction.
5. Customer Effort Score (CES)
The Customer Effort Score (CES) is a powerful customer service performance indicator that measures how much work a customer had to put in to get an issue resolved. Popularized by Gartner, this metric operates on the principle that reducing customer effort is a more reliable driver of loyalty than attempting to "delight" them. The core question is simple: "To what extent do you agree or disagree with the following statement: The company made it easy for me to handle my issue?"
Customers respond on a scale, typically from 1 (Strongly Disagree) to 7 (Strongly Agree). The score is calculated by finding the average of all responses. A higher average indicates a lower-effort, more seamless experience. This metric is crucial because high-effort experiences, like being transferred multiple times or repeating information, are a primary cause of customer disloyalty.
CES is highly effective for evaluating process efficiency. Amazon's one-click purchasing is a direct application of this low-effort philosophy, while Google uses CES to simplify its support channels. By focusing on ease and convenience, businesses can directly impact customer retention and reduce churn.
How to Implement and Improve CES
Effectively tracking and improving your CES involves pinpointing and eliminating friction in the customer journey.
- Deploy at Key Touchpoints: Send the CES survey immediately after a specific interaction, such as a completed support ticket, a product return, or after using a self-service knowledge base. The customer's memory of the effort involved will be most accurate at this moment.
- Ask Specific, Actionable Questions: Tailor the question to the interaction. Instead of a generic query, ask, "How easy was it to get your question answered today?" This provides more contextually relevant feedback.
- Map the Journey to Find Friction: Use CES feedback to identify high-effort stages in your customer journey. A single interaction might be easy, but cumulative effort across multiple steps can lead to frustration. Combine this data with qualitative feedback to understand why a process is difficult.
- Prioritize Process Improvement: Once you identify high-effort interactions, focus on streamlining them. Eliminate unnecessary steps, clarify instructions, and empower agents to resolve issues on the first contact. Test changes and measure the impact on your CES score.
6. Average Handle Time (AHT)
Average Handle Time (AHT) is a foundational operational metric among customer service performance indicators, measuring the average duration of a single customer interaction from start to finish. This calculation includes talk time, hold time, and any after-call work (ACW) an agent performs to resolve the issue. The formula is: AHT = (Total Talk Time + Total Hold Time + Total ACW) / Total Number of Interactions.
AHT is a critical metric for understanding team efficiency, planning staffing levels, and managing operational costs. While a lower AHT often indicates efficiency, it should never be pursued at the expense of quality. For example, telecom companies often have a higher AHT (10-15 minutes) due to complex technical troubleshooting, which is perfectly acceptable if it leads to first-contact resolution.
Many successful companies use AHT to guide process improvements. Comcast reportedly reduced its AHT by 20% by giving technicians better diagnostic tools, while Amazon’s call centers use AHT in conjunction with quality monitoring to ensure efficiency doesn't compromise customer experience.
How to Implement and Improve AHT
Effectively managing AHT is about balancing efficiency with service quality. It requires a focus on processes and tools, not just agent speed.
- Analyze AHT by Category: A high overall AHT can be misleading. Segment your data by issue type, agent, or channel. This can reveal that complex billing inquiries are driving up the average, indicating a need for better training or resources in that specific area.
- Invest in Your Knowledge Base: A significant portion of handle time is spent with agents searching for information. A robust, well-organized, and easily searchable internal knowledge base empowers agents to find answers quickly, directly reducing both talk and hold times.
- Streamline After-Call Work: Simplify and automate post-call processes. Use macros for common notes, integrate your CRM with your support platform to reduce manual data entry, and clearly define what information is essential to log.
- Balance with Quality Metrics: Never use AHT as a standalone performance target for agents. This encourages them to rush customers off the phone, leading to poor satisfaction and repeat calls. Always pair AHT with metrics like CSAT and First Contact Resolution (FCR) to ensure a holistic view of performance.
7. Customer Retention Rate (CRR)
Customer Retention Rate (CRR) is a crucial metric that measures the percentage of customers a company keeps over a given period. It's one of the most powerful customer service performance indicators because it directly reflects long-term customer loyalty and satisfaction, going beyond single-interaction metrics. A high CRR shows that your service and overall experience are compelling enough to make customers stay.
The rate is calculated with a simple formula: ((E-N)/S) × 100, where E is the number of customers at the end of the period, N is the new customers acquired during that period, and S is the number of customers at the start. For example, if you start with 200 customers, gain 40 new ones, and end with 210, your retention rate is ((210-40)/200) x 100, which equals 85%.
This metric is vital for subscription-based businesses and any company focused on building lasting relationships. For instance, Amazon Prime maintains an estimated 93% retention rate after the first year by combining value with a seamless customer experience, while Costco achieves a 90% membership renewal rate through exceptional service and member benefits.
How to Implement and Improve CRR
Boosting retention requires a proactive and data-driven approach that focuses on customer value and relationship building.
- Identify At-Risk Customers: Monitor engagement metrics like product usage, login frequency, and recent support ticket volume. A sudden drop in activity can be a leading indicator of churn, giving you a chance to intervene.
- Implement Proactive Outreach: Don't wait for customers to complain or leave. Create customer success programs that focus on helping users get the most value from your product or service, establishing a partnership rather than a transaction.
- Analyze Churn Reasons: When customers do leave, conduct exit interviews or send a simple survey to understand why. Use this feedback to fix underlying issues in your product, pricing, or customer service processes.
- Segment Your Analysis: Calculate CRR for different customer cohorts (e.g., by acquisition channel, plan type, or signup date). This helps identify trends and shows which customer groups are most loyal, allowing you to replicate that success.
Focusing on retention is often more cost-effective than acquisition, making CRR a key indicator of sustainable growth. For a deeper dive, you can learn more about effective customer retention strategies.
8. Service Level Agreement (SLA) Compliance Rate
The Service Level Agreement (SLA) Compliance Rate is one of the most critical customer service performance indicators for B2B and enterprise-level support. It measures the percentage of customer service interactions that meet predefined service level commitments, such as specific response times, resolution times, or system uptime guarantees.
SLAs are formal contracts that set clear expectations for service delivery. The compliance rate, therefore, directly reflects how consistently an organization meets its contractual promises. For example, if your SLA guarantees a first response within one hour for 95% of high-priority tickets, your compliance rate tracks your performance against that specific target.
This metric is essential for building and maintaining customer trust, especially in environments where service reliability is non-negotiable. Tech giants like AWS and Microsoft 365 publish their SLA compliance rates, often committing to 99.9% uptime and offering service credits if they fail to meet these promises. This transparency provides accountability and a powerful assurance of quality.
How to Implement and Improve SLA Compliance
Effectively managing SLA compliance requires a structured process for setting, monitoring, and acting on performance data.
- Set Realistic and Tiered SLAs: Establish SLAs based on historical performance data and resource capacity, not just aspirational goals. Create different tiers based on issue priority or customer segment, allowing your team to focus resources where they are most needed.
- Automate Tracking and Alerts: Use help desk software to automatically track SLA deadlines. Set up automated alerts for agents and managers when an SLA is approaching its breach point, enabling proactive intervention rather than reactive problem-solving.
- Communicate and Review Regularly: Clearly communicate SLA terms to customers at the beginning of the relationship to manage expectations. Schedule regular reviews of your SLA performance and the agreements themselves to ensure they remain relevant and achievable as your business evolves.
Customer Service KPI Comparison Table
| Metric | Implementation Complexity | Resource Requirements | Expected Outcomes | Ideal Use Cases | Key Advantages |
|---|---|---|---|---|---|
| Customer Satisfaction Score (CSAT) | Low – simple surveys, easy deployment | Minimal – short surveys, basic tools | Immediate feedback on specific interactions | Measuring satisfaction at touchpoints | Quick setup, high response rates, actionable insights |
| Net Promoter Score (NPS) | Low to moderate – single question plus follow-up | Minimal – simple survey platform | Measures loyalty & likelihood to recommend | Tracking customer advocacy and loyalty | Industry-wide benchmarking, correlates with growth |
| First Response Time (FRT) | Moderate – tracking response times across channels | Moderate – helpdesk software needed | Faster initial response, improved customer perception | Customer service responsiveness | Real-time tracking, motivates quicker replies |
| First Contact Resolution (FCR) | Moderate to high – needs clear resolution definitions | Moderate – requires customer feedback and tracking | Higher satisfaction, reduced repeat contacts | Improving support efficiency and effectiveness | Direct link to satisfaction, cost reduction |
| Customer Effort Score (CES) | Low – simple, focused survey questions | Minimal to moderate – context-specific surveys | Identifies friction, predicts loyalty | Streamlining customer experience | Highlights effort reduction opportunities |
| Average Handle Time (AHT) | Moderate – detailed time tracking needed | High – call/chat logging systems | Improved resource planning, operational efficiency | Workforce management and scheduling | Enables capacity forecasting, identifies inefficiencies |
| Customer Retention Rate (CRR) | Moderate – requires longitudinal data | Moderate – CRM and analytics tools | Measures long-term loyalty, revenue sustainability | Subscription and repeat purchase businesses | Strong indicator of business health |
| SLA Compliance Rate | High – requires SLA definitions and ongoing tracking | High – monitoring systems and alerts | Reliable service delivery, customer trust | Contractual/B2B services, ITSM | Objective measure of performance, accountability |
From Metrics to Momentum: Turning Insights into Action
You now have a comprehensive toolkit of the most critical customer service performance indicators. We've explored everything from the immediate pulse check of the Customer Satisfaction Score (CSAT) to the long-term loyalty insights offered by the Customer Retention Rate (CRR). But remember, these metrics are not just numbers to be reported; they are the language your customers use to tell you what they need.
Tracking these KPIs is the essential first step, but the real transformation begins when you turn this data into a continuous improvement engine. Each indicator reveals a unique chapter of your customer's story. First Response Time (FRT) and Average Handle Time (AHT) speak to your team's efficiency, while Customer Effort Score (CES) and First Contact Resolution (FCR) uncover friction points that could be costing you loyalty.
Building a Holistic View
The true power of these metrics is unlocked when you analyze them together. A low NPS score might not just be about a single bad interaction; it could be the result of consistently high customer effort or slow response times. A fantastic CSAT score on a resolved ticket means less if that customer had to contact you three times to get there, a detail only FCR can reveal.
By weaving these data points together, you can move beyond reactive problem-solving and begin making proactive, strategic decisions. This holistic view empowers you to:
- Identify Root Causes: Pinpoint the precise operational weaknesses or process gaps that lead to poor customer experiences.
- Allocate Resources Wisely: Understand where your team needs more training, better tools, or additional staff to meet demand.
- Celebrate Success: Recognize and reward team members who consistently excel in key areas like FCR and CSAT.
Your Actionable Next Steps
Mastering your customer service performance indicators doesn't happen overnight. The key is to start small and build momentum.
- Select Your Core KPIs: Don't try to track everything at once. Choose 3-4 indicators from this list that align most closely with your current business goals. For an e-commerce store, this might be FRT, FCR, and CES.
- Establish Clear Baselines: Track your chosen metrics for at least one month to understand your starting point. This baseline is your benchmark for all future improvements.
- Empower Your Team: Share the data, explain what it means, and involve your agents in brainstorming solutions. When your team understands the "why" behind the metrics, they become active partners in elevating the customer experience.
Ultimately, mastering these performance indicators is about more than just improving service; it's about building a customer-centric culture. It's about creating a business that listens, adapts, and consistently delivers value. By transforming raw data into meaningful action, you forge stronger customer relationships, drive sustainable growth, and build a brand known for its exceptional commitment to service.
Ready to dramatically improve your First Response Time and First Contact Resolution rates? Yoonoo provides an AI-powered chatbot platform that instantly resolves common customer queries, 24/7. This frees up your human agents to handle complex issues, helping you master the customer service performance indicators that matter most.